
An affordable OBDII dongle paired with free software offers impressive capabilities for monitoring and graphing real-time vehicle data, including automatic transmission temperature, engine coolant temperature, and camshaft status. This review explores the setup, functionality, and potential of this powerful diagnostic tool, focusing on its graphing features.
Real-Time Data and Graphing Capabilities
While many OBDII scanners provide data, this particular device distinguishes itself with its ability to graph real-time automatic transmission fluid temperature (ATF), along with other crucial parameters like engine coolant temperature (ECT1 & ECT2), camshaft solenoid status, and even camshaft oil pressure. This level of detailed information surpasses basic code readers and provides valuable insights into vehicle performance. Unlike some alternatives like the ScanGauge, which may display ATF temperature but lack graphing functionality, this OBDII app and dongle combination allows for visual trend analysis.
Setup and Installation
The initial setup requires a few steps beyond simple plug-and-play. Downloading the app, updating the firmware, and installing vehicle-specific software modules are essential for accessing the full range of features. Ensuring a stable Wi-Fi connection during this process is crucial for successful downloads and updates. While not immediately intuitive, the setup is manageable with a little patience. Connecting the dongle to the vehicle’s OBDII port powers the device and enables communication with the app.
Customizing the Display
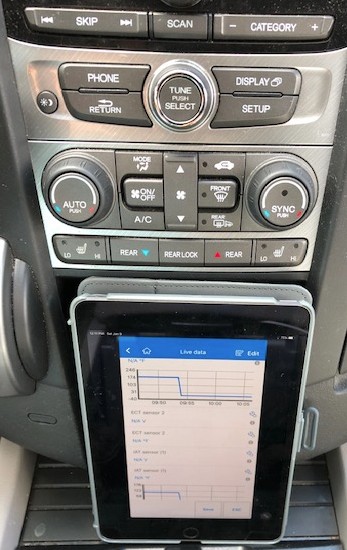
The software allows users to choose between numeric values, graphs, or gauges for displaying live data. Optimizing the screen layout for efficient data visualization is key. Initially, unused data points may clutter the display, making it challenging to fit desired parameters like ECT and ATF temperatures on a single screen, especially in portrait mode. Further exploration is needed to determine the extent of customization options, such as removing unnecessary data points or grouping related parameters.
Practical Use and Mounting
Positioning the device for optimal visibility while driving is essential. Placing the paired tablet or phone on the dashboard, secured with a mount, provides easy access to real-time information. Proximity to a power source for charging is also a consideration.
 143762
Conclusion
This Obdii App With Graphing capabilities offers a compelling solution for monitoring vehicle performance. The ability to visualize data trends in real-time provides valuable diagnostic insights. While the initial setup requires a few extra steps, the potential for in-depth analysis and customization makes this tool a worthwhile investment for car enthusiasts and professionals alike. The ability to customize the display to focus on essential data points would further enhance its usability and make it a true standout in the market.